Background
As a way of ‘grounding’ the content on this site, I believe it’s important to be completely transparent about my live trading track record.
In January 2011 I started trading commodity futures full time through TopStepTrader’s ‘Combine’ evaluation & funding process. It was an opportunity to ‘learn & earn’ — an attempt to validate my approach to trading, improve, and grow towards trading professionally.
I spent approximately two years ‘grinding’ on a simulated account, trying to implement a very mechanical strategy, which was a narrowly-defined bar-pattern sequence based on Volume Spread Analysis (VSA) that was taught by a now-defunct trading educator (NextBarTrading). I sampled several trading products in an effort to find the best ‘fit’ with TopStep’s risk parameters — metals (silver, gold), energy (crude oil, natural gas), and currencies (euro). I found the most success with silver, but TopStep de-listed it as a permitted product literally just days after I achieved the funded level, so I had to start over with the evaluation process, pivoting into my next best product, crude oil.
Along the way, however, my strategy was slowly losing its edge on the intra-day time-frame, as it was, in essence, a long-volatility approach, and volatility was gradually waning in the wake of the Financial Crisis. As I still was quite unseasoned in the realm of futures, I wasn’t sure if the markets were making secular or cyclical changes, and therefore did not know exactly what or how to adjust my approach accordingly. Also, considering the pattern was so narrowly defined, I had no trust in modifying it on a whim; the very thought of doing that just smacked of the endless doomed cycle of chasing the best-fitting-parameters of indicator-de-jour, terrifying me of winding up in the 90%! Fortunately I discovered that a slower resolution, migrating from a 5-minute bar to a 15-minute bar, recaptured enough relevance at that time to generate consistent profits, which helped me secure the funded status again. Interestingly, what was at first the clear-cut ‘signal’ in the sequence gradually became more of a mere ‘clue’, as more and more trading would transpire before price achieved the expected outcome– extra minutes became extra hours; hours became days. Adapting to this change led to a shift from a highly ‘left-brained’ method to gradually requiring more ‘right-brain’ acumen, i.e. intuition, just to stay afloat. Fortunately I was able to adjust, but by the time I achieved funding, I realized I had nearly abandoned the hard & fast rules that I had started with. As I became more a student of the context in an effort to master the art of timing, I found it better to often ignore most instances of the specific pattern, and would occasionally respond successfully with a trade in the complete opposite direction on certain days.
Despite the success in clearing TopStep’s hurdles to achieve funding, I held serious doubt about my prospects at sustainability in the business because I felt like I was then essentially winging it day to day. That led me to take a break from the discretionary side of things in order to push the original indicator quantitatively. I ended up building an elaborate spreadsheet model, spending about two years collecting the data manually and developing the formula logic to perform sufficient testing. That effort resulted in a very unique model that is still in development on its path toward automated/algorithmic trading.
While I was encouraged by the promising results in the model, I ran into the issue of not possessing the programming expertise to streamline the testing process. Single configurations required approximately 14 hours of computation in Excel, which was potentially feasible to run once per week, but was obviously sub-optimal, given the multiple degrees of freedom worth exploring in the model architecture. So I decided to ‘shelve’ the project and focus again on discretionary trading.
I had become familiar with the approaches outlined by forex educator, Martin Cole, the “Market Makers’ Business Model”, and Youtube channel Market Traders Daily content, “Trapped Traders,” which made a lot of sense to me as I had accumulated more than two years of ‘screen-time’ experience. It was a foundational tenant of my original strategy that the markets are dominated by insiders who possess supreme advantages in terms of market-depth visibility, order-flow execution, and perhaps even political influence to orchestrate price moves in conjunction with news events with economic impact. Whereas I previously traded as if the NextBarTrading pattern-sequence effectively captured their ‘footprints’ in the market, I shifted to understanding the market as a repeating cycle of phases. I then sought to isolate my participation with trade decisions to junctures within the cycle where direction became quite obvious and sufficient amplitude was reasonably likely to follow, in order to warrant acceptable risk-taking.
I reentered TopStep’s Combine evaluation in mid-2014, and reached the funded level within about six months. I essentially ‘stumbled out of the blocks’ on the live account for another half year, going back to their “Re-development” Combine twice after having traded for scratch over the first 20 trading days on the live account. Then in November 2015 I finally ‘flew’ out of the gate and stayed on the live account for the following 4 ½ years.
Performance
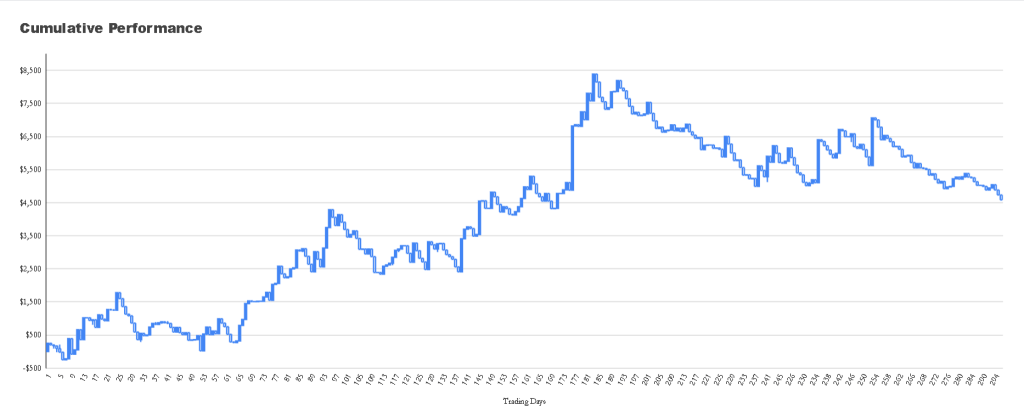
The first chart of my record has the best ‘optics’, and each subsequent chart will get more real.
The first one is titled Cumulative Performance. It is in candlestick form, with each bar representing a single trading day. The x-axis is the number of trading days, and the y-axis is cumulative profit. It does NOT include commissions. At this time the rules for funded traders on TopStep’s “$30k Account” entitled me to trade with $1500 of risk capital. The maximum daily drawdown was $500. Once any positive balance was secured on a daily closing basis, there became a ‘Trailing Max Drawdown’ of $1500 from the equity high water mark. After the first 10 trading days the account could not drop into a negative balance, otherwise it would be closed. Once a trader made any withdrawal from the account, the account could not drop below $0. Permitted trading hours were between 5pm – 3pm CST, with the requirement to be flat at 3pm each day. Traders could not hold open positions within one minute before or after major economic releases.
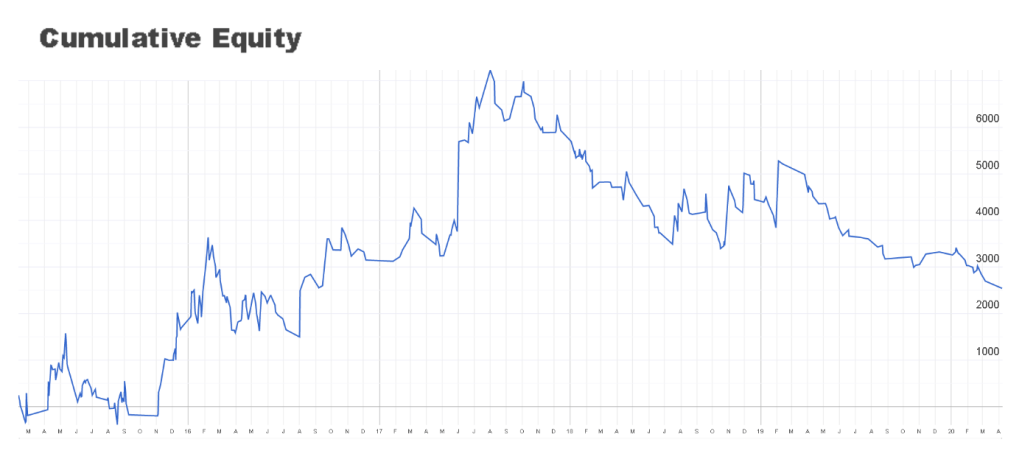
The second chart is titled Cumulative Equity. It includes commissions, which were about $5 per round turn per contract, and added up to about $2000 over the course of five years. I was using minimal leverage, trading a single lot the vast majority of the time. Occasionally I made a second trade in a day, and only very rarely traded with two lots. The graph is the exact same shape as Performance, but obviously the slope is tilted more toward horizontal.

The third chart is also Cumulative Equity data, but it accounts for the passage of time. It is in line-chart format because Google Sheets’ chart options do not support a candlestick chart with a time sequence on the x-axis that would leave gaps on days without trade data. Notice the highest peak shifts to the left in comparison to the prior two charts. This is due to trade frequency dropping significantly in 2018-2020 period.
So, what happened?
The ‘trend’ in the return series is in the desired direction, up and to the right; average winners are larger than average losers, with a win/loss ratio of near 50%. Interestingly, there is a distinct ‘fractal’ pattern of a run-up into a peak, followed by a retrace which extends into a sideways period, which then ushers in another up-leg. There are three mini-cycles which make up a single major-cycle that forms a distinctly similar shape present in all four. Why the repeating shape? I believe this is a result of approaching the market with essentially the same fundamental strategic framework/outlook over the entire period, which waxed and waned in its alignment with the market as it went through higher and lower-order phase shifts, all coupled with a natural psychological imbalance that occurred from being aware of my immediate performance trajectory, which tended to alter my appetite for risk. In general performance would suffer after a successful run with the desire to go ‘pedal to the metal’ or get overly creative, leading to compromising some degree of conviction before entering trades, and would only recover after a humbling experience that would necessitate more patience before executing again.
Notable is the mid-2016 period. At that time I experienced two of the mini-cycles and was very conscientious of over-trading in the wake of initial success, but also wanted to improve and accelerate my development. I had done an abbreviated version of Ray Burchette’s Intuitive Development Training program while working through TopStep’s evaluations, so I decided that it was worth investing in doing the full program. That was a very pivotal decision in my trading journey, as I experienced a distinct ‘bump’ in my performance. (BTW — I cannot recommend his ‘Basic Training’ course highly enough!) The program teaches traders how to become highly focused on the process of assimilating information and organizing beliefs and behaviors in such a way that it makes achieving strategic competitive advantage a natural byproduct of doing the work. As a result of that reflection process in defining my strategy profile, I decided to again slow my time-frame resolution from the 15 minute to a 30-minute period, which resulted in a larger risk/reward trade shape and reduced trade frequency.
Issues
In the wake of the equity peak in 2017 I began suffering from some overconfidence, some complacency, and some general impatience in my life-situation. It began sinking in that even with a generous extrapolation of the prior two-year period, an account value of around $5k would never be large enough, even if doubled or tripled annually, to become real “F-U money”. I’d either need a regular day-job, another side-job, and/or a strategy adjustment– none of which sounded particularly appealing considering I was ‘smashing it’ at the time, feeling like I had earned and achieved something quite remarkable, considering the percentage return on risk-capital and high Sharpe ratio. I resisted change, asking myself Why should I take any of my focus off of this or change what I am doing, when I am doing so well?
The Big Big mistake I made at that time was to try to live out of my meager account, with the belief that I could consistently cover at least a few hundred dollars per month in living expenses if I were to integrate some kind of ‘scalp’ technique into my methodology. That sent me ‘down a rung’ over the subsequent year as I tried to implement a ‘putter – wedge – driver’ approach, in terms of matching a different risk-reward profile and trade frequency to each individual trading session. Whereas I was purely using the ‘driver’ before, a 23-tick stop, a 60-100 tick profit expectation and waiting up to weeks between trades, I then began experimenting with 18/45 and 13/30 risk/reward shapes with the hope of increasing trade frequency to several round turns per week. Suddenly I was no longer patiently waiting for high-conviction moments which culminated after significant build-up — instead I was taking it for granted that I would capture those ‘driver’ opportunities like easy ‘lay-ups’. But then I started missing those as well because my attention was parted; the best moments of opportunity were no longer as transparent as before when I became more caught up in the ‘trench warfare’ of the minor intra-day swings.
Conscientious of the feeling of performance quality slipping, I went back to waiting patiently for the highest-conviction moments and got ‘back on track’ in late 2018. But the prior ‘problem’ returned, with the persistent belief in it not being ‘enough’ to be inactive for so much time between trades. I would spend a ton of time, energy and effort into developing intimacy with the market, always being ready to respond appropriately, but for the most part it felt like something akin to being Cleopatra’s body-guard. It was my duty to be by her side day-in and day-out while she toyed with everyone else, then only once she was fed up with the BS games and disappointment with the small-time boy-toy nonsense would she finally turn to me for something more satisfying. To add to the frustration, prime moments for participating started hitting in all odd hours of the day, so my trading method felt like a broken-clock that was perfectly spot-on only once a month, and sometimes that moment occurred in the Asia or European trading hours, which meant I had to make myself available 18 hours per day. Effectively I was positively identifying the major reversal-junctures that led to swings that were occurring on the weekly/monthly time-frame — that’s where my conviction was highest, and I felt very ‘agnostic’ about the vast majority of interim price action. It just wasn’t sustainable as an intensely focused, full-time devoted endeavor, especially in the dreadfully slow trading that occurred in crude oil in the second half of 2019.
Something had to change. I took on a more steady side job in order to take pressure off of my finances, and vowed to pursue a purely intuitive approach to try to maximize each trading session. I began effectively meditating on the market during the US day session, looking at it as a brief window for a dynamic performance opportunity where the challenge was to integrate as much assimilated information from my nightly preparation and execute in alignment with the moment-specific situations. I started recording all of my thoughts/perspectives/analytical views on one side of my journal, and all of my physical sensations on the other– stomach pangs, tension in the chest, muscle spasms, tingling in different spots around the head, ringing in the ears, etc. What I discovered is that I would also get spontaneous visions that would enter my thought stream that were flashes of dream information from days or weeks prior. I also discovered that ‘linear’ ideas that were a product of over-thinking, stuff I could ‘cook-up’ using deductive candle-pattern or psychological if-then logic that would seem so ‘clever’ in the moment were just too hit-and-miss to be reliable. Instead I could only fully trust my physical sensations and dream information for timing and direction of intra-day price moves.
The issue then was that the intuitive information often felt completely ‘un-tethered’ to my preparation. For example, on a given day I might have been interested in getting long after some kind of decline into a particular zone, which may have been one of a few potential candidates so far as levels I outlined the night before. I would observe price as it then entered the zone; I kept my mind clear and just stayed patient, waiting for a moment of physical sensation to clue me in on the timing. On a specific occasion I suddenly smelled something that I could only describe as “Orange Chicken!?” yet there was no actual smell in my office at the time; it was just a psycho-somatic phenomenon that not-so-coincidentally marked the bottom tick of the day’s range, and BTW my down-bar color on my charts is orange. I realized then that the type of trading I intended to do would mean necessarily drawing from the non-physical realm as much as every other element in my process.
In early 2020 crude oil went berserk, and TopStep subsequently clamped down on their traders in that product, restricting trading hours and briefly suspended trading in it entirely. I took that as a natural juncture to cash out and ‘go rogue’, as I felt I had built enough trust in my discipline, patience and adaptability to take on any market independently, and did not want to be hand-cuffed by anyone else’s parameters.
